
Where I live, on Capitol Hill, new condos are going in daily—and with them, a new and growing population of DC residents. All that population influx has city planners in a tizzy.
So: Are DC students growing at the same rate?
Look at one set of US census data from 2000 and 2010 for DC’s school-age children, compiled by the 21st Century School Fund:
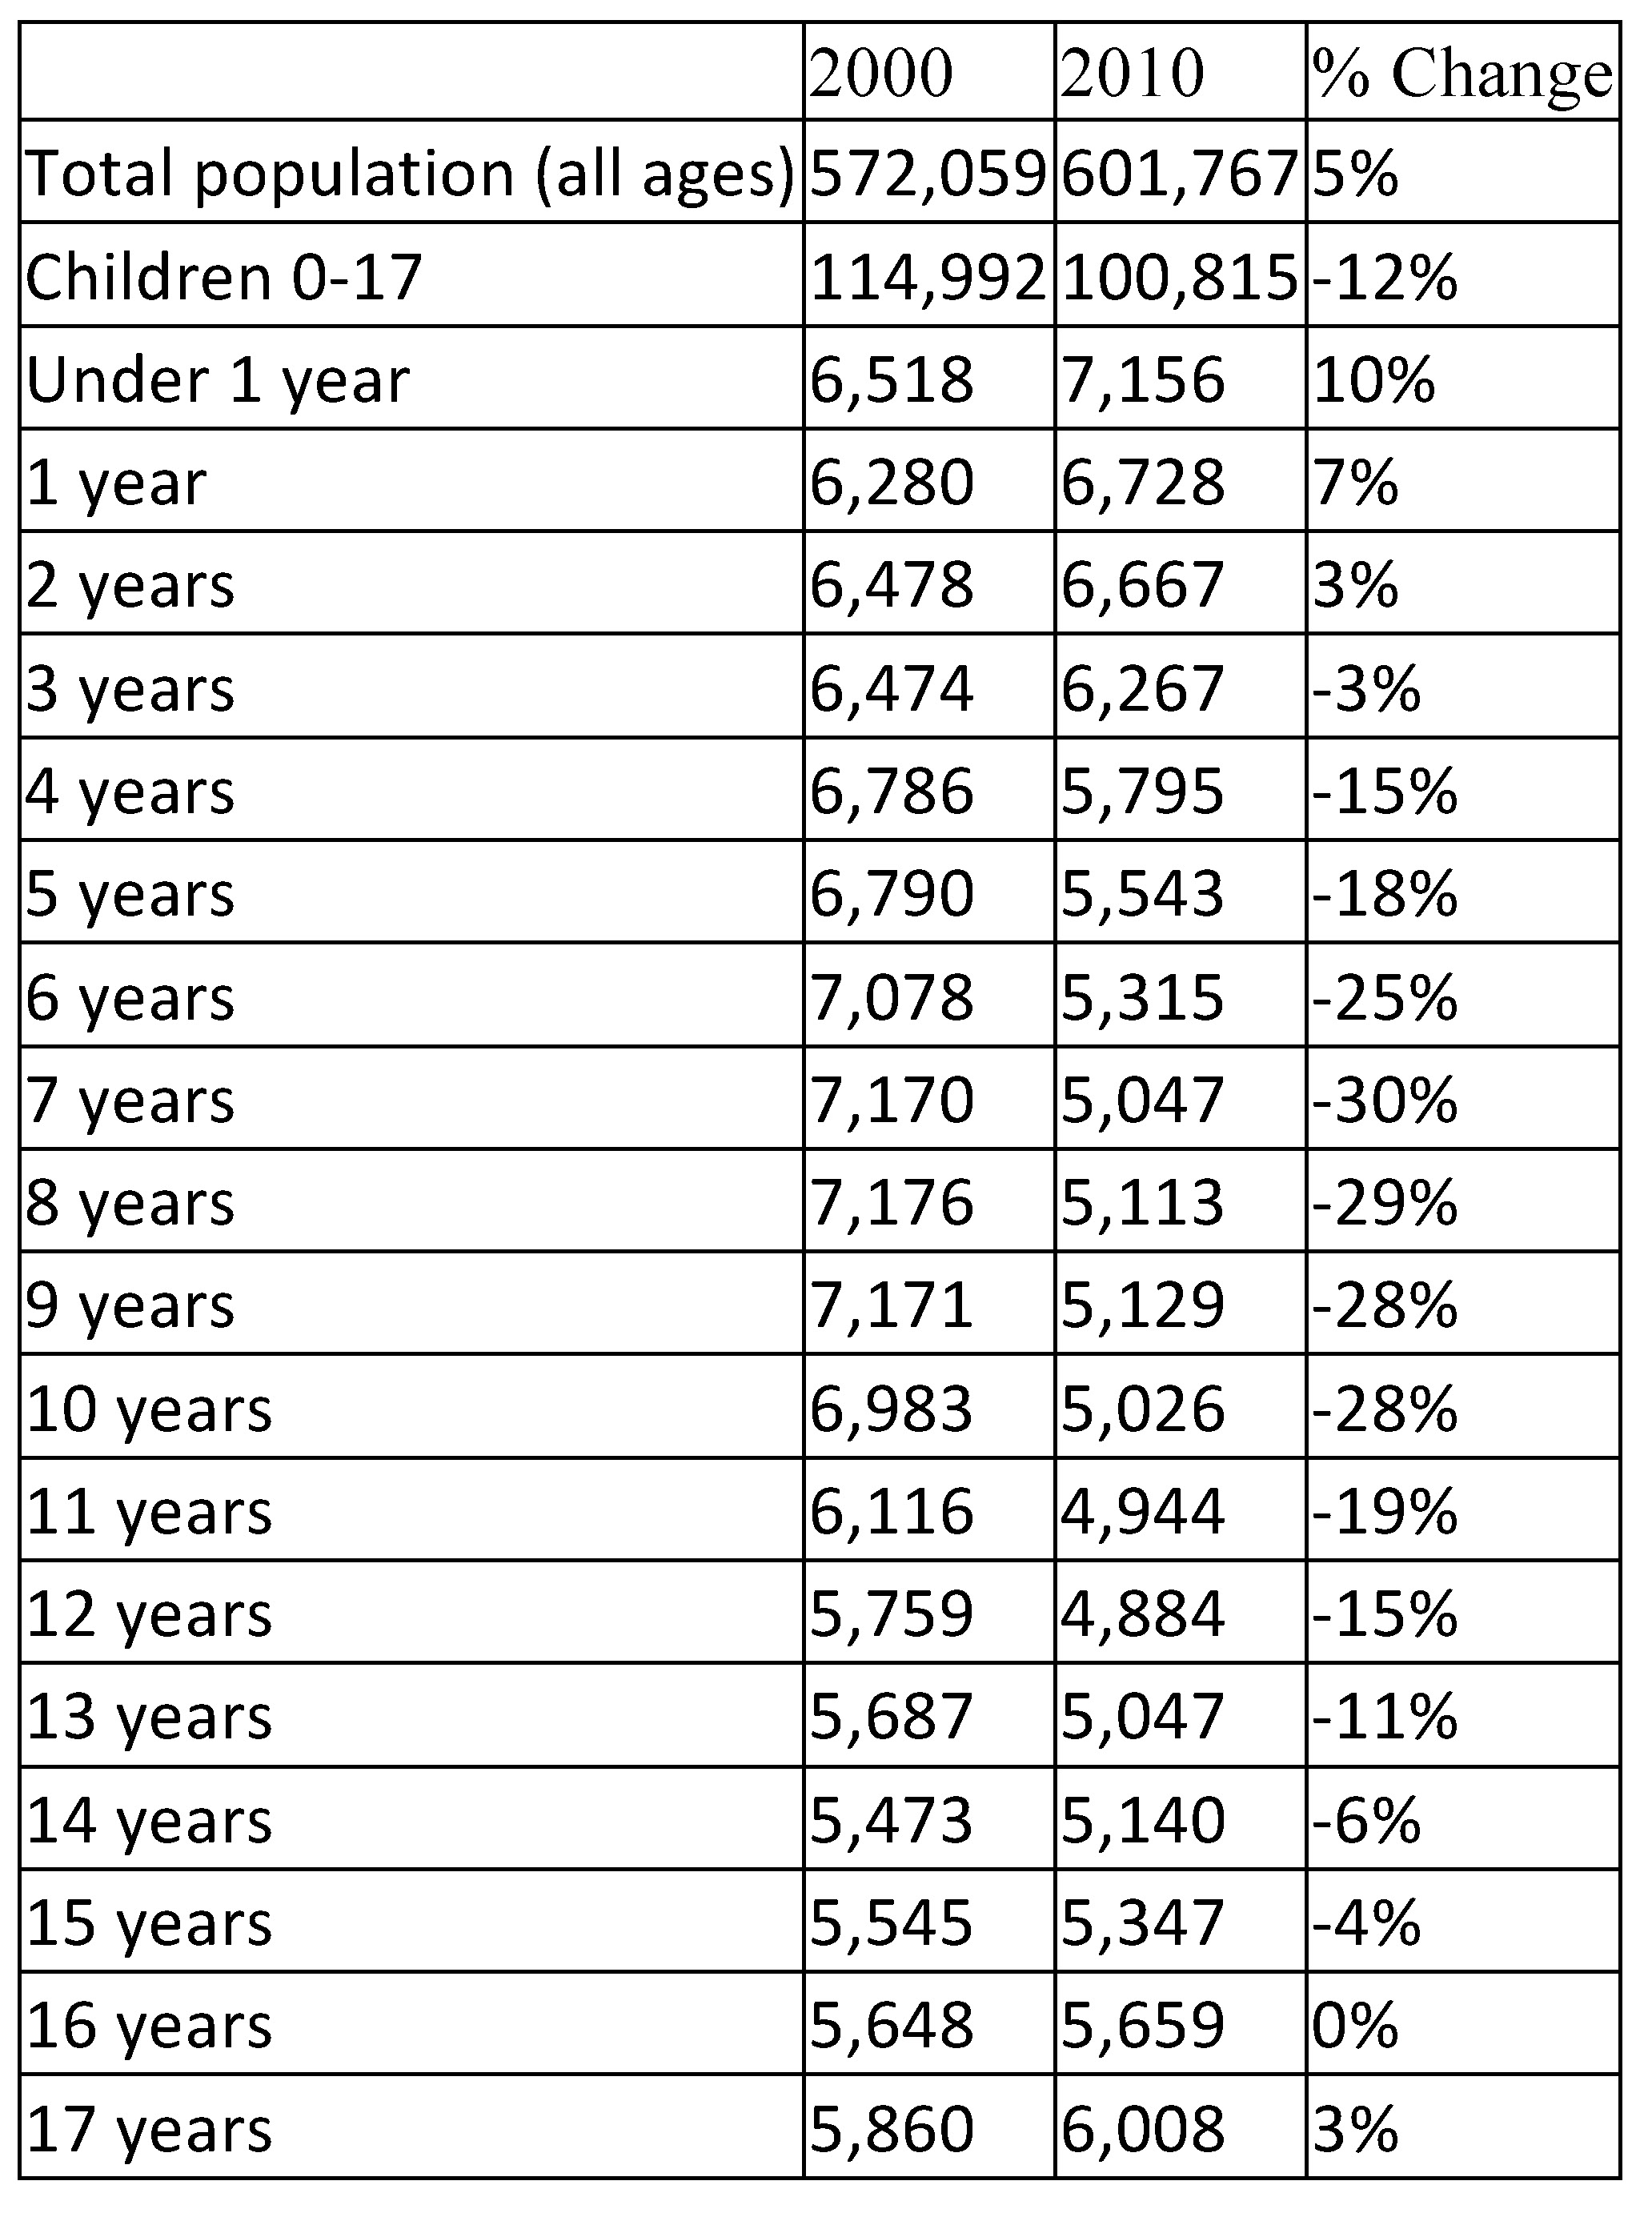
Despite growth overall in DC’s population in that decade, the only groups of children that grew in numbers were babies, 1 year-olds, and 2-year-olds. The growth for each group was 10%; 7%; and 3%, respectively. All other groups of DC children declined in numbers over that decade, despite overall growth in population. And for all child age groups, growth slowed, and declines grew, as the children aged.
Of course, no one chart can predict the future. In fact, one could argue that based on the trend shown—lots of young children—the need for seats in DC public schools will only increase over time.
But look again at that table and this time, shift the columns, so that they correspond to the same children, but a decade later. That is, the 1-year-olds in 2000 become the 11-year-olds in 2010, etc.:
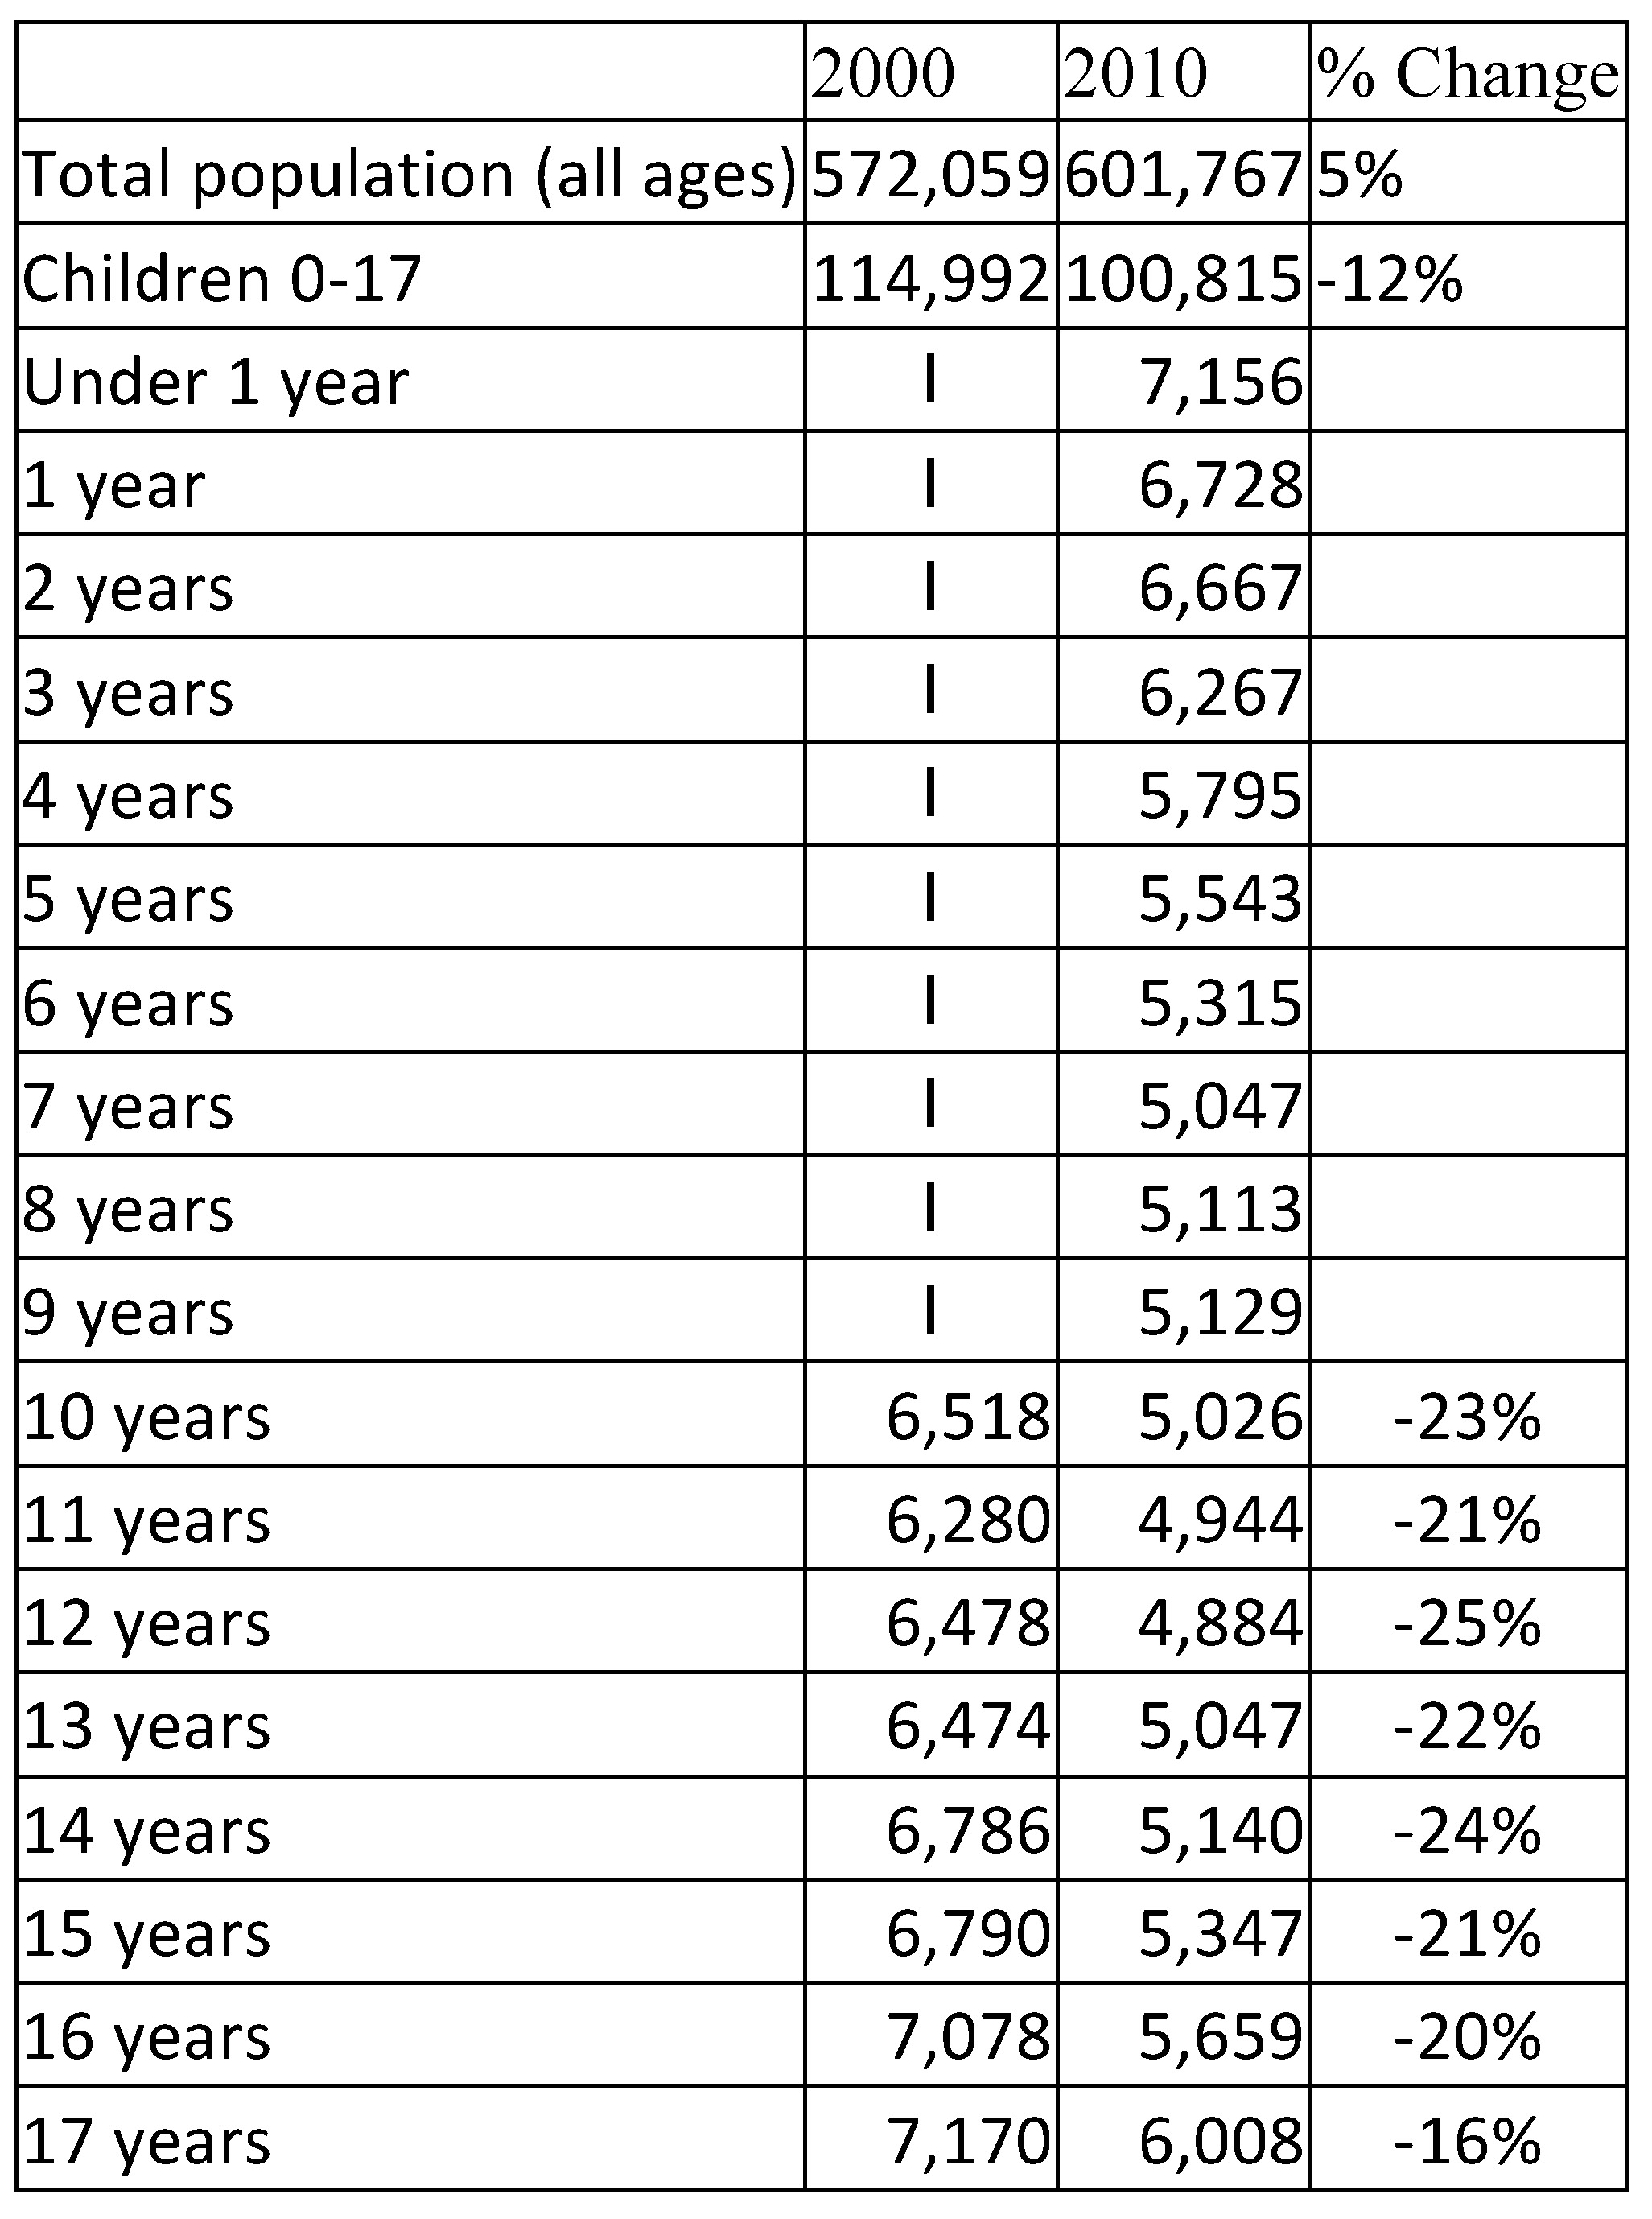
Over that same recent decade, nearly half the age groups of DC kids show declines between 16% and 25%.
Such a decline in the number of DC children is nothing new historically.
Between 1960 and 2000, according to census data, DC’s population declined dramatically—children most of all. In 1960, DC’s 243,054 children were 31% of its population. By 2010, even with DC’s overall population on the rise, our city’s 102,292 children represented a decline of 12% since 2000–and constituted only 17% of the total population. As it is, the total number of DC kids in 2010 was less than half the number of DC kids in 1960.
(Happily, one can conclude that such dramatic declines have largely followed demographics–not DCPS failures, as an op-ed in the Post by charter board members opined earlier this year. Indeed, the most recent decline in DC children between 2000 and 2010 has happened while a large portion of DC students were enrolled in charters.)
That said, the following graph (created using recent OSSE enrollment data) shows what many in DC public education have long known anecdotally: a steady loss of kids from all public schools, both charter and DCPS, over the entirety of a student’s primary and secondary education:

This is not, of course, the dramatic overall DC population decline that began in the 1950s. Nonetheless, it reflects a student population decline that all DC public schools–both charters and DCPS–must deal with and plan for if they are to use their public resources wisely.
(This graph also shows some other interesting DC public education trends: the uptick in charter enrollment at 5th grade with a corresponding loss in DCPS; the dramatic drop-off in both DCPS and charter high schools, possibly reflecting drop-outs; and huge enrollment at young ages, suggesting there are more very young children than school seats available for them at those ages. There’s also an uptick in 9th grade enrollment, possibly reflecting students being held back at that grade.)
So: What does all this mean for the future?
Both the charter school board and DCPS have taken as a given that growth of DC public schools is imperative. Even after the most recent wave of closures of schools for underenrollment, for instance, DCPS opened some new schools and has plans for yet more.
The charter board has resisted calls to coordinate openings of new charter schools, arguing that competition means better schools. As the NRC report on mayoral control of schools detailed, 102 charters have been granted in DC, with 38 since closed and 8 never opened, making for a charter closure rate approaching 40%. More recently, a report from the Progressive Policy Institute notes that a third of all charters have closed over the last 18 years, making a closure rate of 33%.
Amid this high rate of closures is a high rate of new school creation. For instance, in 1999-2000, DC had 185 public schools serving 74,800 students. In 2014-15, DC had 223 public schools serving 85,400 students (data from the 21st Century School Fund).
Thus, over a decade and a half, with a gain of 10,600 public school students (14% growth), we have 38 more public schools (20% growth).
Somewhere in that differential–14% versus 20%–is the real cost of school closures and openings. Both require immense resources–whether siting a new school, renovating a school building, or ensuring other schools can handle students from closed schools.
Not to mention the effect on communities.
After the 2008 DCPS closures, children whose by local, by right schools closed attended charters at twice the rate of children whose schools did not close. Clearly, a chance at a lottery slot for a charter school is one thing–having a neighborhood, by right school is quite another. (A recent blog by DC’s Office of Revenue Analysis mirrors this trend, by noting the seemingly improbable lack of diversity in both DCPS and lottery-only charters.)
Perhaps the most hidden cost of uncoordinated school openings is what happens when there are just not enough students to go to all those new schools.
One can hope that the deputy mayor for education’s task force will take that question square on, even if the DME herself cannot compel participation by those who oversee nearly half of DC’s public education students.

Very interesting, Suzanne. I will link to you on my blog (gfbrandenburg.wordpress.com) – I often look at this type of data myself.
Guy B
LikeLike