
Some weeks ago, the Progressive Policy Institute released a study titled “A Tale of Two Systems: Education Reform in Washington, DC.” The study was funded by private organizations that promote charter schools and concluded that in DC, charter schools have structural differences that allow them to “outperform” traditional public schools run by DCPS.
The only problem: there are more than two school systems in DC.
Look at this graph of DC public schools, created by Guy Brandenburg, a retired math teacher:
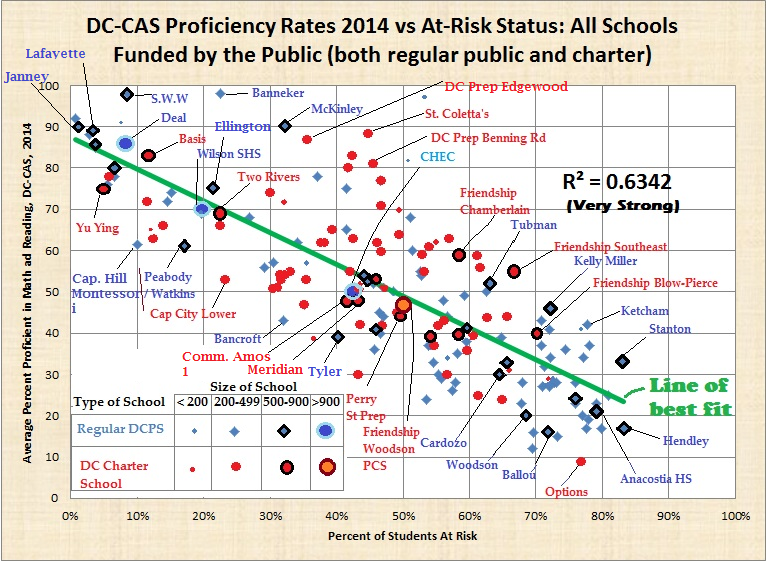
There is a clear and abiding correlation of a school’s at risk population to test scores. Namely: the more at risk students a school has, the lower the test scores, whether charter or DCPS.
“At risk” is a relatively new term in DC school parlance. It encompasses many aspects of poverty that earlier measures of student poverty (usually the percentage of students qualifying for free and reduced priced meals) were unable to suss out clearly.
This is important because what we know now in DC is that poverty is not all the same for everyone and that at risk kids are, in fact, among the poorest of the poor. Moreover, it is also clear that the schools with the highest percentages of at risk kids struggle to attain higher test scores, regardless of who runs those schools.
Thus, while it is convenient to characterize schools in DC as comprising two systems—charter and DCPS—reality is quite different.
There are, in fact, many school systems.
For one, there is the system of schools with relatively large percentages of wealthier kids, comprising mainly (though not exclusively) DCPS schools in Ward 3.
Then there is the system of schools with large portions of poor kids who do well in test scores. Here, for example, are the 2014 percentages of free and reduced meal students at some of DC’s public middle schools, all of which enjoy relatively high test scores but only some of which have large percentages of poor kids:
Stuart-Hobson (DCPS): 57%
Hardy (DCPS): 56%
BASIS (charter): 30%
Washington Latin (charter): 25%
Deal (DCPS): 21%
Then there is the system of schools with good educational outcomes for everyone, which is not the same as the first two systems (or even reflected in high test scores). This is a school system in which charters and DCPS show different strengths, not superiority of one over the other.
And then there is the system of schools with deeply poor kids who, as the graph above shows, do not do well on test scores. Most of those schools are run by DCPS, not charters—that is an artifact of demographics (which the study notes).
And then there is the system of schools that simply do not exist in this or other such studies. That would include DCPS schools that had been operated by charters—Anacostia, Dunbar, and Coolidge high schools—and failed.
As selection bias shows, studies funded by bodies with an interest in a particular outcome (in this case, more charter schools) tend to be self-fulfilling. This latest study comes on the heels of a much more comprehensive (but similarly funded) study in 2012, which was debunked by independent researchers.
In our era of school choice and limited education funds, ensuring we clearly see all our school systems and understand why they exist, and how, is of paramount importance.
