
Part of the difficulty in writing about DC’s boundary process and the associated master facilities plan (MFP) is that the civic actors at the head of both have thus far assembled an array of data so predictable in its conclusions that there is almost no reason for any discussion.
Which appears to be the point.
After all, these civic actors have bolstered their ideation of the closure of schools like Sousa with data showing that most kids in bounds attend other schools; test scores are not high; and its building (like so many other schools of right on that side of DC) itself largely unused (footnote 1).
Setting aside that large parts of Sousa were rendered unusable due to neglect and lack of integration in an earlier renovation, and that the school has often been ignored around robust funding and programming, the information the deputy mayor for education (DME) and his acolytes have assembled in support of its closure is impressive—well, except that we don’t have any real data.
Yes, Virginia: we don’t have any data to show, among other things,
–historic disinvestment in Sousa;
–historic out-migration of in boundary students as a result of those disinvestments coupled with increased seats of choice (and civic sales pitches for those seats);
–student mobility expected with closure or re-assignment;
–impacts on the feeder system with a co-location or closure;
–how much of the building would be dedicated to a co-location (and why);
–which co-located entity would be there; and
–expected savings or revenues arising from closure and/or co-location.
And that’s just for Sousa. No word on such data for other schools with so-called low utilizations, some of which the DME has identified for re-purposing or co-location. That includes (but is not limited to) Malcolm X, Moten, Hart, Johnson, Anacostia, Ron Brown, and Kramer (charmingly misspelled on slide 25 here).
The paucity of actual data available to the public around these proposed changes is of a piece with the paucity of publicly available public input on those proposed changes. Of the 13 individual school meetings the DME has held thus far on proposed boundary changes, the DME has provided publicly available recordings of only three: Brent, Maury, and Mann. Here is a recording of a December 4 meeting (and the meeting Q&A) that Ward 6 council member Charles Allen and W6 and W7 state board of education reps Brandon Best and Eboni-Rose Thompson held for all the DME’s proposals for Capitol Hill schools. And here is what I copied of the last boundary town hall’s Q&A on December 14. (Good luck for the rest.)
One possible reason for the public voice not being memorialized fulsomely around these proposed changes is that the public has a good nose for (and limited tolerance of) nonsense.
It also may be (as DME chief acolyte Jennifer Comey put it at the boundary advisory committee meeting on December 5, at about the 1 hour, 25 minute mark) that the DME’s proposals are simply “ideas” and thus inherently at a remove from the natural democratic scrutiny associated with large, unexpected, and sometimes unwelcome changes in the public sphere—say, like bombing campaigns.
Now, I can think of plenty of “ideas” that I would never drop on anyone for any reason—especially “ideas” that come with forcibly ended careers, public buildings, communities, and education rights.
So it is that after this last round of boundary town halls, we are left much like the volunteer members of the boundary advisory committee on December 5 who, when presented with the map below of proposed programming in DCPS schools (from that meeting’s slide deck), had to ask who decided all of that and whether the schools had any knowledge of the changes—only to get the response that these were merely “ideas.”

It is worth recalling that before we got to this anti-democratic morass, the boundary advisory committee formulated four guiding principles for its work on boundaries:
–a strong system of by-right neighborhood schools;
–equitable access to high quality schools;
–predictable and continuous access to schools; and
–racially and socio-economically diverse schools.
At the same time, no fewer than four well-remunerated private organizations have worked on both the MFP and boundary study. The overlap of the two projects is considerable, but the (paid) actors involved have never bothered to meaningfully connect a lot of data (i.e. renovations that expand capacity in contradiction to in boundary population numbers (Brent, Hyde-Addison) or enrollment (Banneker)), while ignoring a lot of other data (i.e. historic disinvestments).
Yet, those same (paid) actors have access to DC education data on a scale that makes everything the public has access to look miserly.
So here we are, with education leaders who–while literally ignoring historic disinvestments in schools serving less affluent students; overgrowth of seats and schools leading to declining enrollments at schools serving less affluent students; and propaganda around test scores–simply align capacity with waitlists and “performance” and conclude that some schools do not appear to be making the cut.
It’s all right here, in the DME’s newly revealed boundary “tool.”
Naturally, there’s nothing there about historic disinvestments—and certainly nothing as basic as actual capacities of actual buildings.
Now that last piece may seem like it’s splitting hairs, but when you consider that Burroughs recently had to fight to stay close to its school for its renovation when no fewer than TWO DC-owned school buildings blocks away have enough space between them to accommodate every single Burroughs student, it’s very relevant.
Specifically:
No one working on the MFP or boundary study cares that Taft (the former DCPS school occupied by two charters) and Slowe (another former DCPS school occupied by a charter) could have accommodated another school (footnote 2). No one is doing that math (at least publicly)—and there is no political will to make DC use *all* its own buildings for DCPS students when there are charters that want them and (in the case of Taft) may be profiting from them.
Likewise, no one working on the MFP or boundary study cares about the hard numbers of students living in bounds to schools of right because if they did, it would reveal the big lie behind both the boundary and MFP processes:
In areas with the largest concentrations of less affluent students, there is not enough capacity in DCPS schools, while capacity in areas with the largest concentration of more affluent students has been expanded to accommodate more than the numbers of students who actually live there (footnote 3).
Consider that but for Bancroft, every elementary school in the Jackson-Reed and MacArthur feeder system (in the wealthiest area of DC) has more capacity than public school students living in bounds. At the same time, most DCPS elementary schools east of the Anacostia River (in the poorest areas of DC) have capacities below the number of students living in bounds.
Worse, many of the schools with more capacity than students living in bounds have received renovations that have either kept their (oversize) capacity or expanded it!
Thus, there has been a purposeful strategy to create de facto magnet schools on the west side of DC by way of modernizations and out of bounds slots. (Of course, the magnet piece is only for those with the ability to travel.)
Not coincidentally, many schools east of the Anacostia are designated in the boundary and MFP work as underutilized without a peep about their historic disinvestment–including the encouraged emigration of their students westward to bolster the “diversity” of schools in the wealthiest area of DC.
There’s also no word about the diversity of schools east of the Anacostia.
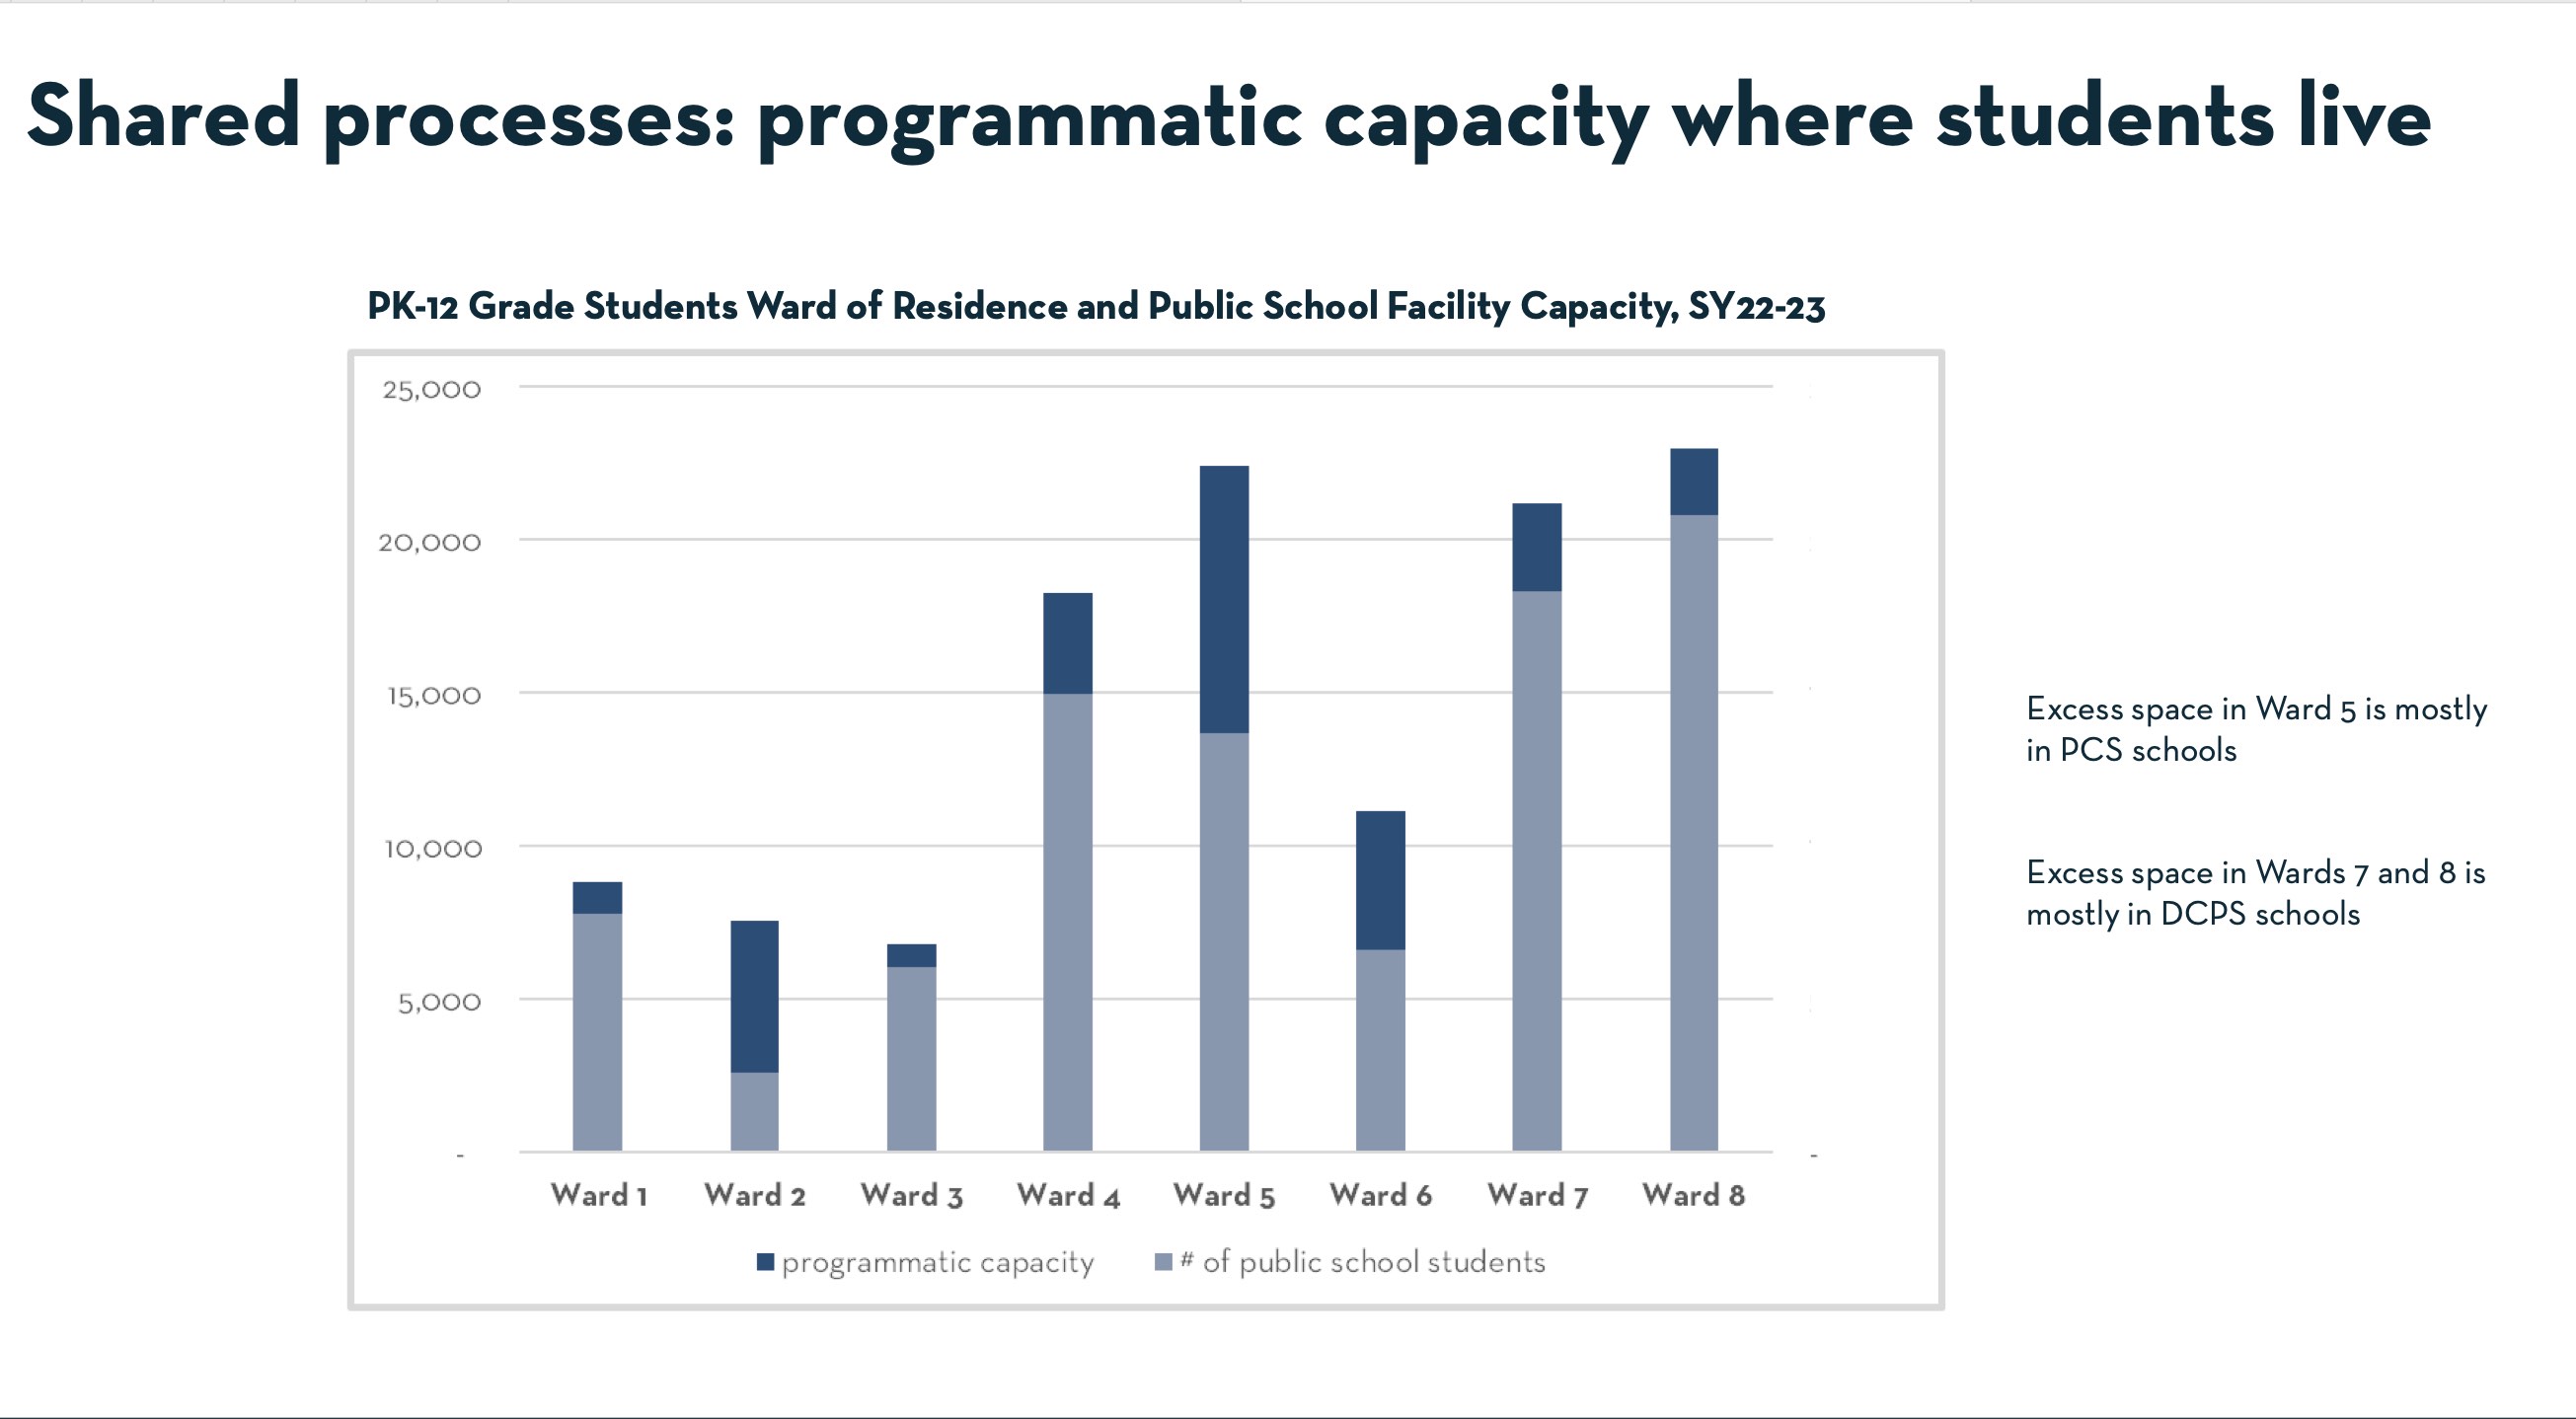
So it was that during the December 5 boundary advisory committee meeting, lack of space for all students east of the Anacostia to avail themselves of their seats of right was translated by the DME’s people into the graphic below, showing that “excess space” EOTR (remember: less space than can accommodate all students in bounds) is “mostly in DCPS schools”:
The boundary town halls engaged in much the same bait and switch: using waitlists and test scores as metrics of virtue while casting underenrollment as an effect of choice (and not of purposeful civic disinvestment) and entirely ignoring not merely students who choose their in bounds schools east of the Anacostia, but also the fact that not all students there can avail themselves of THAT choice because there is literally not enough capacity.
At this juncture, we probably should consider ourselves lucky that these same public servants didn’t act on any of this back in 2019, when they were ideating about closures and similarly ignoring the choice of families to choose their in bounds schools with low test scores and lots of impoverished students.
In the years since, these very same civic actors (who have, not coincidentally, elected to avoid their schools of right in favor of charters; DC’s top public high school of choice; and private school) have been given unimpeded platforms to showcase manipulated data and spurious “ideas.”
But these civic actors are hardly unique.
After all, at no particular historic juncture have DC’s education leaders ever voluntarily appeared to be concerned about school segregation and diversity. The closest they have ever come is with the expansion of capacity in the wealthiest, whitest area of the city (and then, only for carefully curated diversity through out of bounds slots). Even with several court decisions saying otherwise, DC’s leaders have continuously tolerated (and in fact encouraged) brutally segregated schools of right, by way of brutally segregated resources, funding, renovations, and student bodies.
(Look at this, just on Sousa.)
Now, with most DC families engaging in some form of school choice, DC education leaders have also tolerated and encouraged brutally segregated schools of choice, under the cynical pretense that choice is the same for everyone (it isn’t) and if parents choose such that we have mostly segregated, lottery-only schools, well, that’s the way that chance works (it doesn’t).
If DC education leaders wanted to have “racially and socio-economically diverse schools” (as the boundary guiding principle goes), they could do so overnight: get rid of boundaries, make all schools follow the same rules, put every student’s name in a hat, assign all students randomly, and institute bussing.
But they will never do this because DC’s current school segregation (and its fellow traveler, inequity) serves their interests far more. All of it provides a manufactured need for, and facsimile of, choice for many people who feel (and/or know) they have none, while ensuring a steady supply of bodies, real estate, and public money to the private interests that run our charters. That in turn pleases the private interests that back those charters and fund our DC leaders.
Turns out, $2 billion of annual public funding to DC public schools is quite an incentive.
So it is that these upstanding civic actors have proposed a solution to “racially and socio-economically diverse schools” in DC by pairing two socioeconomically different schools (Maury and Miner) for the sole reason that they are close to one another—while happily ignoring the lack of diversity everywhere else (even at schools near Miner and Maury). At the same time, the wealthiest (and whitest) area of the city can boast it has diverse student bodies (love those out of bounds slots!) all in walking distance of the most valuable residential real estate in DC.
Mission accomplished!
In the 1940s, DC resident John Davis sued DC because his Black child’s commute to school was many times longer than the commutes of his neighbors’ White kids to their (White) schools. But Davis’s lawsuit was dismissed. The court felt the difference in commuting distances didn’t show actual discrimination but “inconvenience.”
That clever distinction is surely one that DC’s current education leaders, with their commitment to overlooking school disinvestments and the racially charged brutality behind them, can appreciate—especially because no matter how outraged any of us is by any of this, the mayor and her loyal servants can do literally whatever they want.
Closures are coming.
FOOTNOTES
1. Though there are several separate data sets that contain this data, the DME put it together on this chart, which was dumped on the DME’s website on December 4, supposedly in support of the boundary work.
Nonetheless, the website it’s on is unconnected to the boundary websites, and the boundary advisory committee members I sent it to said they had never seen it. (I found it quite by accident on December 9, and I am unaware of any other publicly released data set showing this information.)
Note that the chart aligns capacity with enrollment and test scores (the “OSSE framework score”). Yet the category “MFP adjusted future capacities” does not show how that number is derived or related to work on these facilities even though the same people are working on the MFP concurrently. Possibly worse, there appears to be no accounting of unusable space at schools like Sousa.
Note also that there is no accounting of out of bounds or lottery slots at supposedly “high” utilization schools (i.e. if Walls is so overcrowded, why doesn’t it accept fewer students?). There is also no accounting for the actual number of students in bounds for each school of right (i.e. the kids who have a right to attend those schools).
Ironically, other data sets at the same website with this chart show the numbers of students living in bounds to schools of right, and those numbers are startling because they show a purposeful effort to encourage the movement of students from schools on the east side of town to the west side of DC. For a discussion of this, see footnote 3.
2. The former DCPS school Taft (201,000 square feet) has long been undersubscribed by its leaseholder, Perry St. Prep. As result, that charter school has sublet a lot of space, including about 21,000-31,000 square feet to LAMB. LAMB is moving out entirely from Perry St. this school year (if it has not already). That said, there is a third charter school contained in Taft, Sojourner Truth, which has both a middle and high school.
Per the DME’s boundary tool, here are the numbers for these schools at Taft:
Perry Street Prep elem.: 69% utilized, 650 capacity, 321 enrollment
Perry Street Prep MS: 69% utilized, 650 capacity, 129 enrollment
Sojourner Truth MS: 70% utilized, 300 programmatic capacity, 166 enrolled
Sojourner Truth HS: 70% utilized, 300 programmatic capacity, 44 enrolled
The total programmatic capacity of these two charters (i.e. the space inside Taft that they have assigned to themselves) is much less than what Taft could hold (300 + 650, or 950 students versus about 1500 students). The enrollment of these two charters is 660 (321 + 129 + 166 + 44), which gets to what the schools have indicated is their utilization rate. A portion of Taft is also leased to a private school that has less than 100 students.
Bottom line: No one is reporting Taft itself is about 50% empty, despite the rosy 70% utilization rates reported in the tool, and that it could have held some portion (if not the entirety) of Burroughs for its renovation.
Another nearby school, the former DCPS Slowe Elementary in Brookland, is also undersubscribed. Leased for years by the Mary McLeod Bethune charter school, it comprises about 54,500 square feet. The two facilities that Bethune has (one on 16th Street NW and Slowe) are combined for this purpose thusly:
Bethune elem: 62% utilized, 500 capacity, 258 enrollment
Bethune MS: 62% utilized, 500 capacity, 50 enrollment
That means that 308 Bethune students are spread across two facilities, one of which is 54,000 square feet and can hold 400 students. We do not know what the size of that (privately owned) 16th St. facility is—but assuming it has at least 50 students (a fair assumption based on lottery slots), that means that Slowe has only about 250 students, or close to the reported 62% utilization.
Bottom line: No one is reporting that Slowe could have held some portion of the Burroughs student body during its renovation in the approximately 20,000 square feet that are unused at Slowe.
There are dozens of such DC-owned former DCPS buildings leased by charters for which we have poor reporting, potentially representing a huge loss of capacity for swing space and programmatic expansions in DCPS. The DME and his peeps have this data—why are they not releasing it?
3. This is shown clearly by looking at the difference between reported capacities in the chart in footnote 1 (see here) and the numbers of students living in bounds for each school (see here).
Unfortunately, the DME and his merry band of helpers never did that analysis—at least publicly.
To visualize that and provide data to make the statements in this blog post, those two datasets have been merged in this modified chart.
In the tab “merged data sets,” column C has negative and positive numbers. Those represent the difference between reported capacities and students in bounds for each school. The negative numbers in column C indicate more public school students in bounds than the school can accommodate, while positive numbers indicate extra capacity beyond the numbers of public school students in bounds.
While some fields in column C on this chart have been left blank, because the DME has not provided data for some education campuses broken out by grade, the numbers we do have are startling.
For instance, Hyde-Addison has 165 kids who live in bounds for it, but yet has a capacity of 421. There is no growth of kids anywhere in the city that would justify that size. The same is true of nearly every school in Ward 3, all of which have had renovations in the last 20 years. Thus, we know that what is being prioritized in those schools is their ability to choose their own size (basically, like a charter but without any public oversight) and expand it to accept students out of bounds.
The irony continues inasmuch as some schools of right with so-called “low” utilizations have huge numbers of students in bounds to them—for instance, Savoy (888 students in bounds), Sousa (1029 students in bounds), and Anacostia (2595 students in bounds).
While this makes clear a purposeful strategy to create de facto magnet schools on the west side of DC by way of modernizations and copious out of bounds slots, we lack demographic data for each school separated out by its in boundary and out of boundary students.
For this chart, the percentage of at risk students (column D) and the percentage of students at each school from wards 5, 7, and 8 (column E) are (clumsily) standing in place of that. Those values are not merely poor (and possibly misleading) proxies for actual demographic data, but are also from different years.
That’s because this is the most recent data for each that anyone in the public has. The DME is choosing to not release demographic data for each school’s in boundary and out of boundary students–even when the DME was given a guiding principle of racial and socio-economic diversity in schools. Who does that serve?

Still I hold on to the hope that sooner or later the PUBLIC in DC Public Schools will do what’s necessary to restore its voice in the decisions about ITS schools. The last sentence here is a great clue–change the law, the Public Education Reform Amendment Act of 2007, that gave the mayor all the power over DCPS “do what ever they want.”
LikeLike
The above comment is from Sarah. 7th Streeter is the name of a newsletter I used to publish before Citizen Reader but the new format doesn’t give me the option to change it as it used to.
LikeLike