
During the June 13 graduation accountability hearing before the education committee of the DC city council, council members laid into DCPS interim chancellor Amanda Alexander repeatedly about what DCPS had done, was doing, and would in the future do regarding graduation accountability. Alexander hewed close to information DCPS compiled, represented in part by this document.
No one thought to question the implied graduation rate represented in the chart below, produced by the charter board:
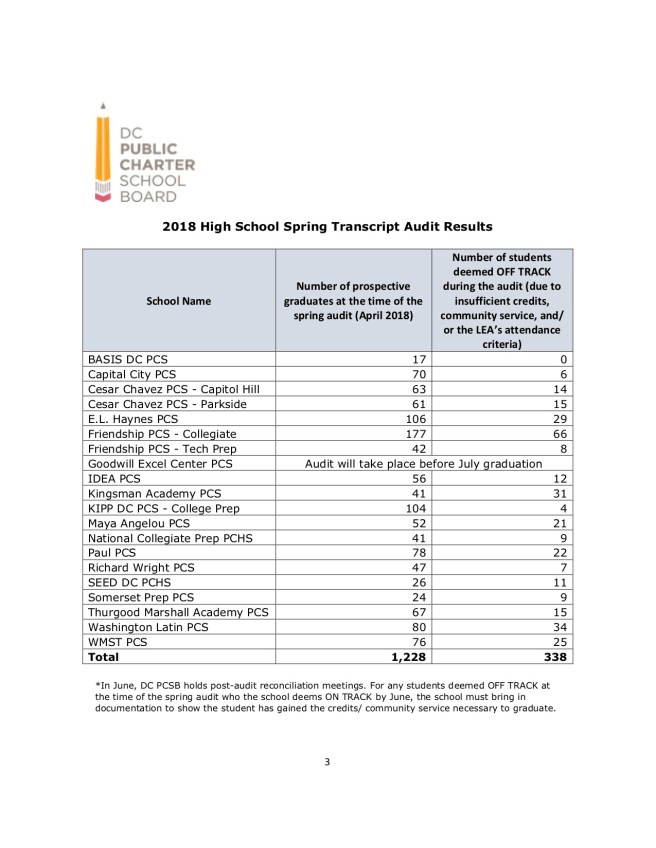
Let us unpack this for a moment.
First, some stats on DC public school enrollment (using data from OSSE audited enrollment reports and the SY16-17 final graduation report from OSSE):
Fall 2012 9th grade enrollment: 6252 total (2280 in charters; 3972 in DCPS)
(this enrollment includes both the entering 9th grade class as well as students held-back from previous years)
Fall 2016 12th grade enrollment: 3370 total (1147 in charters; 2223 in DCPS)
(this enrollment represents the retention of students and any net transfers through the high school years)
That works out to the following (extrapolated from data in OSSE documents here and here):
Adjusted cohort in spring 2017 as a percentage of 9th grade enrollment:
71% = DC’s public schools
63% = Charters
76% = DCPS
Graduation rate in 2017 as a percentage of 9th grade enrollment:
54% = DC’s public schools
46% = Charters
58% = DCPS
(NB: The DCPS values above don’t count its two STAY programs, since the 9th grade enrollment for those programs is reported as “adult”)
Contrast those 2017 graduation rates with what works out to a bonny 73% for 2018’s charter school graduation rate via that chart above (i.e., divide the “off track” total by the total of “prospective graduates” and subtract from 100 to get the graduation rate).
To be sure, 2018 is not 2017, and we do not yet have the final, OSSE-blessed 2018 graduation stats.
But the graduation rate that the charter board gave for last school year (2017; 73.4%) was about the same as its preliminary figure above for 2018. (See here and here for more information.)
Now, look again at the charter board numbers above for “number of prospective graduates” as of April 2018 (i.e., students likely to graduate).
But this time, let us back out the percentage that “number of prospective graduates” represents of all 2018 seniors (as accounted in that chart above) and also include the numbers of kids who once were at the schools in question in 9th grade (according to OSSE audited enrollment data); the numbers of students gone; and the percentage (in bold) those lost students represent of those “prospective” 2018 grads:
BASIS: 17 prospective 2018 grads (100%); 27 in 9th grade; -10 students (59%)
Capital City: 70 prospective 2018 grads (92%); 93 in 9th grade; -23 students (33%)
Chavez Cap Hill: 63 prospective 2018 grads (82%); 152 in 9th grade; -89 students (141%)
Chavez Parkside: 61 prospective 2018 grads (80%); 115 in 9th grade; -54 students (89%)
E.L. Haynes: 106 prospective 2018 grads (79%); 169 in 9th grade; -63 students (59%)
Friendship Collegiate: 177 prospective 2018 grads (73%); 249 in 9th grade; -72 students (41%)
Friendship Tech: 42 prospective 2018 grads (84%); 60 in 9th grade; -18 students (43%)
IDEA: 56 prospective 2018 grads (82%); 70 in 9th grade; -14 students (25%)
KIPP College Prep: 104 prospective 2018 grads (96%); 150 in 9th grade; -46 students (44%)
National Collegiate Prep: 41 prospective (82%); 79 in 9th grade; -38 students (93%)
Paul: 78 prospective 2018 grads (78%); 129 in 9th grade; -51 students (65%)
Richard Wright: 47 prospective 2018 grads (87%); 71 in 9th grade; -24 students (51%)
SEED: 26 prospective 2018 grads (70%); 36 in 9th grade; -10 students (38%)
Somerset: 24 prospective 2018 grads (73%); 47 in 9th grade; -23 students (96%)
Thurgood Marshall: 67 prospective 2018 grads (82%); 136 in 9th grade; -84 students (125%)
Washington Latin: 80 prospective 2018 grads (70%); 86 in 9th grade; -6 students (7.5%)
Washington Math, Science, Tech: 76 prospective 2018 grads (75%); 98 in 9th grade; -22 students (29%)
Yes, yes, this is in part a silly exercise: it doesn’t capture who actually graduates. (I also left off a school that had changed operation in the last 4 years (Kingsman) and an alternative high school (Maya Angelou).) Presumably, some of the students in the original chart who are deemed “off track” may, in fact, actually graduate–which would reduce the percentage loss of students over time.
That said, there are several untold, and very important, stories here:
1. The city as a whole is losing students at the high school level. They may be moving, they may be dropping out—but they are leaving both charters and DCPS at relatively high rates.
2. The concept of an adjusted cohort, while legally mandated by the U.S. Department of Education, captures numerically some of that shift, by noting students leaving or arriving. But it also obscures the whole story of student mobility that in DC has an outsize (and negative) influence on our schools and their students. Our students are not merely transferring between schools, sectors, and/or jurisdictions a lot—they are also disappearing from our high schools in large numbers before graduation. We also do not know what percentage of the adjusted cohort 4 years later represents the original 9th grade cohort at each high school. In our city of choice, this amounts to statistically turning our backs on high mobility (and, as the cross sector task force explored, its known, negative effects on at risk kids) and investing in the adjusted cohort as an accurate representation of a whole picture. For districts with relatively immobile populations, relying thusly on the adjusted cohort may work well. But here in DC, that apparent “whole” as measured via the adjusted cohort is in reality a complex and rapidly changing mosaic, comprised of different students not merely across school years, but within them as well.
3. Whether one looks at either the bald graduation rates of 9th graders or the adjusted cohort figures, it is clear that our charter high schools are losing students at higher rates than DCPS high schools. My jiggering of the rosy charter board data also underscores this loss (amazingly, sometimes more than 100% of those “prospective” 2018 graduates).
4. This last bit underscores what charter board executive director Scott Pearson characterized during the Kojo Nnamdi show earlier this week as successful accountability, with 27 charter schools closed over his tenure of 6 1/2 years. That works out to an average closure rate of four DC charter schools a year.
In fact, just since our most recent 2018 graduates entered high school, five publicly funded high schools in DC were closed, most of which were charters:
Spingarn (DCPS): 129 students affected
Options (charter): 115 students affected
Hospitality (charter): 53 students affected
Booker T. Washington (charter): 69 students affected
Perry Street Prep (charter): 153 students affected
These closures mean that in just four years more than 500 public high school students in DC were actually made mobile in some way not because they chose it, but because it was foisted on them.
When such vaunted “accountability” increases mobility in a city filled with at risk kids who are demonstrably harmed by such mobility, perhaps a better question to ask is who is benefitting from accountability via closures–and who is responsible for the resultant increase in mobility.
The upshot of all of this is not the propaganda that charter high schools are more honest or doing better than DCPS.
Rather, one upshot is that our charter high schools are losing students more than DCPS, which could be a function of any number of things: teacher turnover; selectivity of kids; higher rates of dropping out; etc.
Worse, that net loss of students fuels deceptively higher graduation rates when those rates are calculated by counting only each high school’s 12th grade class at one point late in that year and arriving at a graduation percentage.
Worst of all is that the most vulnerable students in DC, who we know need stability to do well in school, are literally being left behind at the high school level in both sectors. This problem is particularly acute in our charter high schools–which our city leaders have thus far refused to include with DCPS in an independent investigation.
In other words, by intensely focusing on graduation rates alone (especially in one sector versus another), our city leaders enable misinformation and propaganda, all the while the kids who need the most attention continue to not get it.
Funny how that doesn’t seem to make the paper.
