
The city council’s education committee will hold a hearing on January 30 (sign up is here) concerning two bills–B22-0594 and B22-0179–that could eliminate most suspensions of children younger than high school age in addition to providing greater scrutiny of, and justification for, DCPS suspensions.
The bills together attempt to provide guidance for all publicly funded schools in ensuring that “no student in kindergarten through grade 8 may be subject to an out-of-school suspensions [sic] or expulsion, unless a school administrator determines that the student has willfully caused, attempted to cause, or threatened to cause significant bodily injury or emotional distress, to another person” and that “such an out-of-school suspension shall be for no longer than 5 school days for any individual incident, or 20 cumulative school days during an academic year.”
Now, one could reasonably hope that our public schools are already doing this, given how harmful time spent out of school is, particularly for our city’s most vulnerable students.
But right now, our city’s public schools struggle with high and disproportionate rates of suspensions, with black, poor, and special education students much more likely to be suspended than other students. According to a 2017 GAO report, during SY15-16 nearly half our city’s charter schools had suspension rates greater than 10%–and the rate for DCPS as a whole was not far behind.
And yet, even in light of a DC charter school with a 40% suspension rate for 5-year-olds and some DCPS high schools underreporting suspensions, the “multi-agency” plan that the GAO called for in its report appears to be originating in only one place: our city council, which has no direct oversight of any school or education sector.
Indeed, the council’s distinct lack of power in this regard was highlighted by DCPS chancellor Antwan Wilson and charter board executive director Scott Pearson. In a joint statement about the proposed legislation, DC’s two school sector leaders decried “mandating a one-size-fits-all approach” and said that the city should instead “support schools in tackling the underlying issues facing students.”
That reaction was in accord with responses from DC’s office of the state superintendent of education (OSSE) and the charter board to the GAO report. Both agencies asserted that no one in the city government has any power to regulate disciplinary practices in our schools. The charter board cited the School Reform Act as “a strong legal bulwark against the District government, including the public charter school board, mandating school disciplinary processes,” while OSSE noted that as an agency, it has “no clear authority to regulate” DC charter schools.
Oh, dear: Seems no one can do anything about suspensions!
Well (at least according to Chancellor Wilson and Executive Director Pearson), maybe, possibly, “tackling” the “underlying issues” that face students everywhere.
OK, I’ll bite: Let’s “tackle” the “underlying issue” of how we report suspensions.
While Pearson’s and Wilson’s joint statement above notes progress in lowering suspension rates (“over the past 5 years, suspensions have fallen nearly 5 percentage points in both DCPS and public charter schools”), the truth is that it is mighty tough to figure out what actually has happened.
Rates of suspensions in DC’s public schools have been reported as dropping (see here and here).
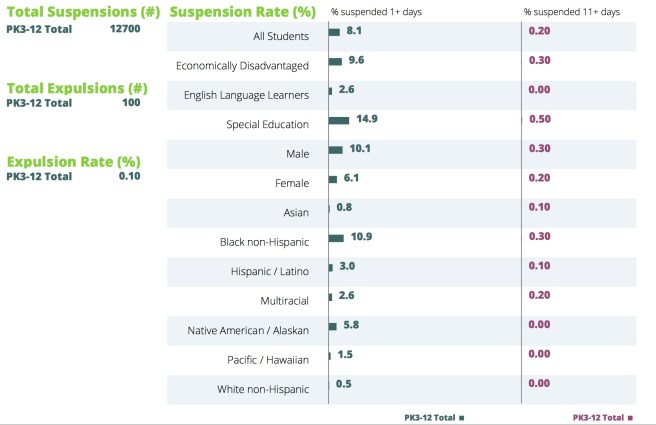
Yet, in the latest citywide equity report from OSSE, using SY16-17 data, the overall city rate for suspensions is–well, your guess is as good as mine. A bar graph on page 2 shows a percentage rate for all students, for suspensions greater than 1 day, as 8.1%.
Copyright 2017: OSSE
That same graphic also shows a bar for all students suspended for 11 days or more, with a percentage of 0.2%.
Sooo: is the overall rate for suspensions 8.3% (8.1 + 0.2)? Or just 8.1%? And what about in school versus out of school suspensions? Partial day suspensions?
Things get really fun when you look at the legally mandated (thank you, city council!) discipline report that OSSE most recently produced, using SY15-16 data.
[Ed. Note: OSSE just released this report using SY16-17 data. As far as I could see, there is nothing new except worsening disparities.]
On page 10 [of the SY15-16 report], OSSE reports that in that school year, “7,324 [students] received at least one out-of-school suspension, 883 received at least one in-school suspension and 99 were expelled.”
That would seem to mean that 8,207 students in SY15-16 (7324 + 883) were suspended.
Later on page 10, OSSE notes that in the same school year “7.8% of students received at least one out-of-school suspension, 0.9% of students received at least one in-school suspension and 0.1% were expelled.”
That would seem to mean that 8.7% (7.8% + 0.9%) of public school students that year were suspended in some way.
Then, starting on page 64 of the same report, the percentage of students suspended in and out of school for each LEA is listed. DCPS, being one LEA, is shown to have a 0.8% in school suspension rate and an 6.8% out of school suspension rate. This would suggest DCPS’s overall suspension rate that school year was 7.6% (6.8% + 0.8%).
Sooo: can one conclude that the difference between DCPS’s apparent overall rate (7.6%) and the apparent overall rate for all public schools (8.7%) is due to the charter sector having an overall higher suspension rate than DCPS? Or to differences in data? Or to differences in reporting?
Who knows? The preferred official talking point–suspensions are NOT a one-size-fits-all kind of thing–is belied by official reporting that makes it look like most schools are, in fact, all the same!
Indeed, in this discipline report [and the one from SY16-17] the only way to discern differences in suspensions is to scroll through the individual LEA data starting on page 64 [of the SY15-16 report–starting on page 59 of the SY16-17 report], isolate each school’s rate, and then do the calculations oneself. Who has the time for that? Isn’t this what we’re paying our city officials to do?
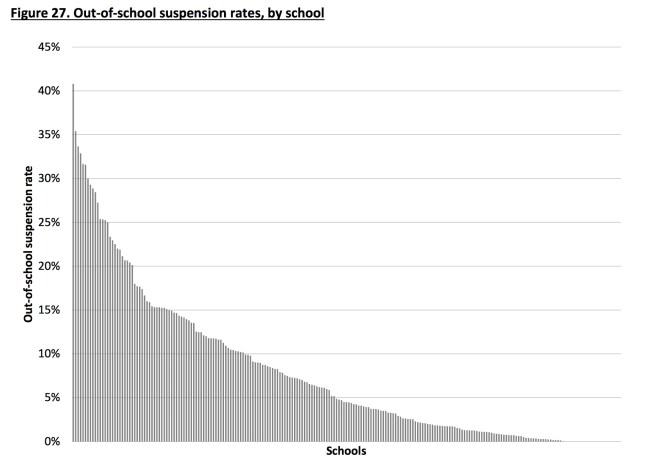
Perhaps in response to these questions, on p. 42 [of the SY15-16 report–on p. 44 of the SY16-17 report] there is a graph that endeavors to show out of school suspension rates by school:
Copyright 2017: OSSE
Looking at this over my shoulder the other day as he watched TV, my 16-year-old son commented, “Where’s the x-axis?”
Yes, indeed: where IS that pesky x-axis?
To be sure, not labeling the x-axis fully ensures that one needs to spend no time to understand that some of our public schools have, well, very high suspension rates, with what looks like about a quarter having rates higher than 10%.
But which schools have which rates is completely obscured.
Even assuming the lack of a fulsome x-axis label here is the result of poor graphic skills, it signifies much larger problems. To wit:
1. Our city agencies that actually do know this information are not making it clear to the public in an accessible way;
and
2. Through regulatory absence, our city agencies are giving a number of schools wide regulatory latitude while those schools have high (and harmful) suspension rates;
and
3. While our city agencies decry any action on the part of the council (or calls for change by the GAO) to address high suspension rates, we know that suspensions are disproportionately visited on some of our city’s most vulnerable kids, with such predictably awful results that at least one group recently has called for an immediate audit.
So, if Chancellor Wilson and Executive Director Pearson really do want to “tackle” the “underlying issues” that would “support schools,” those items above should cause them to rethink their laissez faire approach to school governance. Namely, it’s clear that right now, there’s ample incentive for education decision makers at all levels to not do the right thing.
(And, yeah, I am talking about Ballou–and now Columbia Heights Education Campus and who knows how many charter schools–but hey, we won’t know that last bit, will we, since city officials are officially investigating only DCPS?)
Talk about not supporting schools!
On January 30, expect to hear a lot about the low bar our education leaders have set for the council’s new legislation.

One thought on “DC Public School Suspensions—or, “Where’s The x-Axis?””