
In her blog post from the beginning of this school year, Suzanne Wells examined a phenomenon in DCPS neighborhood schools on Capitol Hill: the exodus of 4th graders from neighborhood DCPS elementaries to charter middle schools at 5th grade.
As the principals of those neighborhood elementaries attested, the students who left to enroll in charters were performing at proficient or advanced levels.
Now, recent PARCC scores appear to validate those observations city-wide.
At the highest scoring levels in PARCC–reported by OSSE as 4+ (that is, at levels 4 and 5) and 3+ (level 3 and above)–ELA scores declined from 4th to 5th grade within DCPS, while those scores in charters at the same grades went up.

This mirrors a similar shift in PARCC math scores between sectors from 4th to 5th grade:

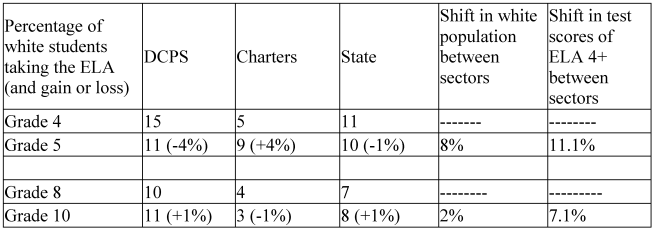
This shift of the highest test scores between charters and DCPS at those grades (one declining, while the other rises) is mirrored in test score shifts in both sectors from middle to high school, another crucial juncture in DC public education.
That is, while charters appear to have higher PARCC test scores in 8th grade relative to those in DCPS, that changes by 10th grade, such that DCPS appears to have the highest test scores relative to charters:


Here is a summary of these PARCC test score differences between DCPS and charters at those key grades:

While it would be comforting to say that such shifts in the highest PARCC scores are evidence that charters do better than DCPS at the middle school level, and DCPS better at the elementary and high school levels, one cannot make that conclusion because there is no significant change at the state level scores for most of these grades:

This is important to note because of the near parity of absolute numbers of students in charters and DCPS. That is, if one sector was demonstrably having much better test scores overall, you would inevitably see it in the state scores. (We can see, however, that the highest math scores for grade 10 overall are significantly lower than those for grade 8, so one conclusion could be that scoring well on PARCC demands something else in math instruction than is currently given in most DC public high schools.)
Now, if you look at the group of DC public school students with the consistently highest overall PARCC scores–white students–you will see a corresponding demographic shift at those critical grades (4th to 5th, 8th to 10th) that mirrors the same pattern of the test score shift between charters and DCPS for those same grades:
One could also conclude that the generally smaller percentages of higher scores in both charters and DCPS at higher grades (grades 8 and 10) is reflective of a smaller percentage of the highest scoring students taking those tests at those higher grades. Whether that is due to smaller absolute numbers of those students at those grades or attrition over time is unclear, although historically student attrition over time is very strong in DC public education.
Taken together, these results do not suggest that one sector has superior (or inferior) educational strategies or achievements at any juncture–as some have suggested and as some parents clearly believe when they pull their children out of their DCPS neighborhood elementaries to go to charters at 5th grade.
Rather, these results show that demographic shifts in student population affect test scores–shifts that, at least for some Capitol Hill elementaries, have difficult ramifications (and, it would appear, for some charter high schools as well).
Just don’t hold your breath that any education leaders will discuss this publicly–because it gives the lie to commonly held notions of school competition, choice, and test scores as unmitigated barometers of educational virtue.

Good piece Valerie. Obviously socio-economic factors are huge. What is important, however, is to see how teachers in both charters and regular schools rise to the challenge, and how much their students improve. The Common Core can’t be taught in a year. The idea is to let the enriched content improve everyone as a reader, and reap the benefits of that. Obviously middle class kids get enrichment at home that schools with lots of low income kids have to work hard to provide. But that doesn’t mean they should give up that struggle and just say they can’t succeed against the weight of socioeconomics. Lots of DC schools, charter and regular, have already proved progress for such kids is possible. Your good analysis helps us see clearly where we are now, and make it easier to judge what happens next.
LikeLike
Thanks. Teachers and schools rise to many challenges–but what is clear from how these PARCC test scores play out at those critical grades (4th to 5th, 8th to 10th) is that whatever challenges teachers and schools face are increased by the movement of students between sectors at those critical junctures.
The principals at those Capitol Hill elementaries that lost students after 4th grade talked about the negative effect that had on their schools. I know parents on LSATs at some of those schools who have sweated bullets trying to figure out how to sustain their schools’ 5th grade. This is not the challenge of educating kids who may not score as well on tests as those who left.
Rather, in a city wherein many people use test scores to judge schools, it is the challenge of ensuring seats are filled and budgets sustained. It is the challenge of ensuring that a school is not penalized–monetarily or through the lottery–for having its test scores drop through just a shift of demographics. And, because we have no coordination between charters and DCPS (still waiting on that task force!), it is the challenge of dealing with this for the long haul, when nearly half of the students attend charters whose middle schools do not at all align with the other sectors’ elementaries, leaving a distinct disconnect that affects one sector overwhelmingly through no action of its own.
LikeLike
Great blog, Valerie.
It’s important to point out that the way test results are used is statistically bogus, from start to finish:
A) Average proficiency rates are vague. OSSE, DCPS and the charter board, should post for the public what they give the Walton Foundation: All demographic and performance scores reported as SCALE SCORES and RAW SCORES, from 2005 to 2015 (source DCPS contract with the Walton Foundation, August 31, 2011, 10 pp FOIA)
1) Using the SCALE SCORES, what are the cut scores, i.e. what percentage of the RAW SCORES, translated into SCALE SCORES, determines a 2, a 3, a 4 & a 5 in each subject at each grade level?
2) When are the cut scores determined, before or after the RAW SCORES and SCALE SCORES are reported to OSSE, DCPS and the charter board and charters?
(Is that why it took an extra month to report the Gr3-8 results to the public?
3) Will those cut scores be the same for the life of PARCC or can they be changed each year?
4) Do any school officials get to see the testing blueprint, which determines which standards will be tested – – and which ones won’t be tested?
B) Comparing this year’s 4th graders to last year’s 4th graders is comparing “apples to oranges.” Why are two different groups of students assumed to be validly comparable for “accountability” purposes?
ANSWER: The “school,” a euphemism for teachers and all staff, is presumed to be the only variable that affects student performance, so schools can be closed, neighborhoods disrupted and teachers fired.
1) Oh, but if disaggregated into “groups” (race, gender, disadvantaged, sped, etc), it’s supposed to be OK! OSSE doesn’t even report 25th and 75th percentile “proficiency” rates (like the NAEP)
2) And why is OSSE suppressing data from groups of less than 25 (<25)? Last year it was <10; in 2013, it was <25; in 2012, it was <10; 2006 to 2011, it was <5 on the nclb.osse.dc.gov site).
C) A test that has no consequences for students – other than closing their schools and firing their teachers – does not generate motivation to excel.
D) The test results do not incorporate data such as absences, esp. unexcused absences. How can a student absent over 21 days be compared to one present almost every day?
E) In releasing test results, OSSE should explain to teachers and the public, ON THE BASIS OF EACH TESTS' COMPONENTS, why some students did well and why others did poorly.
The refusal to do that needs to be questioned.
Part of the answer will be found in students' previous performance + attendance & behavior. They are ignored, because the school reform philosophy holds that, at each grade level, "school," i.e. teachers, are capable of moving students up to grade level, regardless how far behind and disinterested the students are.
LikeLike